D3 Project
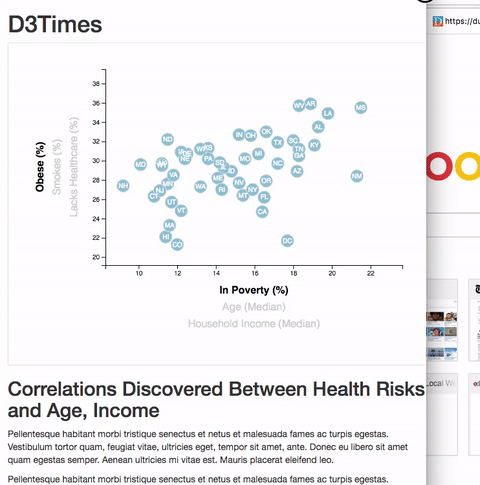
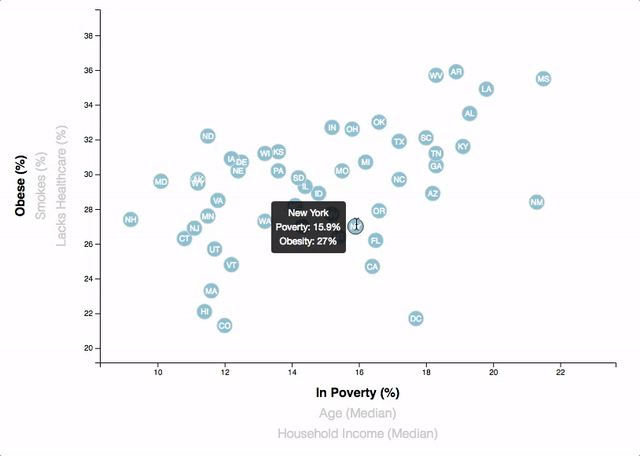
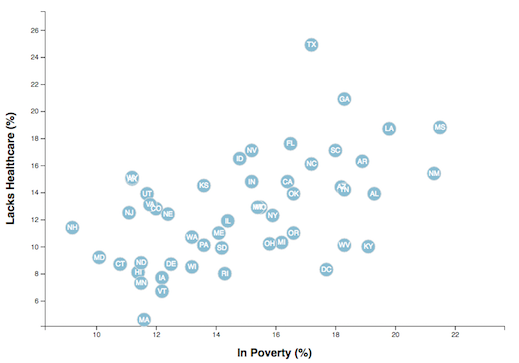
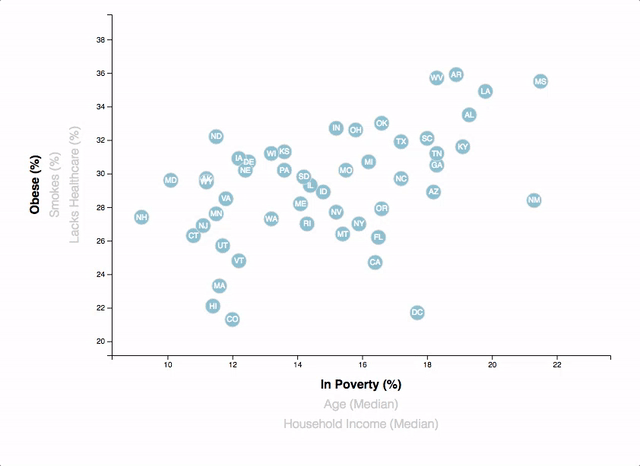
I just accepted a fake data visualization position for a major metro paper and I was tasked with analyzing the current trends shaping people's lives, as well as creating charts, graphs, and interactive elements to help readers understand my findings. The editor wants to run a series of feature stories about the health risks facing particular demographics. My job was to sniff out the first story idea by sifting through information from the U.S. Census Bureau and the Behavioral Risk Factor Surveillance System.
Check out this project!